Elastic Stack is an amazing and powerful collection of four open source projects –Beats, Elasticsearch, Logstash, and Kibana. Despite each one of these four technologies being a separate project, they have been built to work exceptionally well together. Elastic Stack is a complete end-to-end log analysis solution which helps in deep searching, analyzing and visualizing the log generated from different machines.
![]()
Elasticsearch is a search engine based on Lucene. It provides a distributed, multitenant-capable full-text search engine with an HTTP web interface and schema-free JSON documents. Elasticsearch is developed in Java and is released as open source under the terms of the Apache License. According to the DB-Engines ranking, Elasticsearch is the most popular enterprise search engine based on Lucene. (Apache LuceneTM is a high-performance, full-featured text search engine library written entirely in Java. It is a technology suitable for nearly any application that requires full-text search, especially cross-platform)
Elasticsearch is developed alongside a data-collection and log-parsing engine called Logstash, and analytics and visualization platform called Kibana. The three products are designed for use as an integrated solution, referred to as the “Elastic Stack” (formerly the “ELK stack”).
Elasticsearch can be used to search all kinds of documents. It provides scalable search, has near real-time search, and supports multitenancy. Elasticsearch is distributed, which means that indices can be divided into shards and each shard can have zero or more replicas. Each node hosts one or more shards and acts as a coordinator to delegate operations to the correct shard(s). Rebalancing and routing are done automatically. Related data is often stored in the same index, which consists of one or more primary shards, and zero or more replica shards. Once an index has been created, the number of primary shards cannot be changed.
Elasticsearch uses Lucene and tries to make all its features available through the JSON and Java API. It supports faceting (filtering, navigation) and percolating (The percolator field type parses a json structure into a native query and stores that query) which can be useful for notifying if new documents match for registered queries.
Another feature is called “gateway” and handles the long-term persistence of the index; for example, an index can be recovered from the gateway in the event of a server crash. Elasticsearch supports real-time GET requests, which makes it suitable as a NoSQL datastore, but it lacks distributed transactions.
History
Shay Banon created the precursor to Elasticsearch, called Compass, in 2004.While thinking about the third version of Compass he realized that it would be necessary to rewrite big parts of Compass to “create a scalable search solution”. So he created “a solution built from the ground up to be distributed” and used a common interface, JSON over HTTP, suitable for programming languages other than Java as well. Shay Banon released the first version of Elasticsearch in February 2010.
Elasticsearch BV was founded in 2012 to provide commercial services and products around Elasticsearch and related software. In June 2014, the company announced raising $70 million in a Series Capital funding round, just 18 months after forming the company. The round was led by New Enterprise Associates (NEA). Additional funders include Benchmark Capital and Index Ventures. This round brings total funding to $104M.
In March 2015, the company Elasticsearch changed their name to Elastic.
In June 2018, Elastic filed for an initial public offering with an estimated valuation of between 1.5 and 3 billion dollars.
Elasticsearch: Concepts & Components
- Cluster: A cluster is a collection of server machines (Nodes) which holds the data. The data is divided between multiple nodes so that it can be replicated and Single Point of Failure (SPoF) doesn’t happen with the ES Server. Default name of the cluster is Elasticsearch. Each node in a cluster connects to the cluster with a URL and the cluster name so it is important to keep this name distinct and clear.
- Node: A Node is part of a server and is termed as a single machine. It stores the data and provides indexing and search capabilities, along with other Nodes to the cluster.
- Shard:
• Piece of an index
• Splits an index horizontally for scaling
• Replication via replica shards
• Replicas are never allocated on the same node as the primary shard
• Allows for fault tolerance
• Scales search throughput
Due to the concept of Horizontal scaling, we can virtually add an infinite number of nodes in an ES cluster to give it a lot more strength and indexing capabilities.
- Index: An Index is a collection of documents with somewhat similar characteristics. An Index is pretty much similar to a Database in a SQL-based environment.
- Type: A Type is used to separate data between the same index. For example, Customer Database/Index can have multiple types, like user, payment type etc. Note that Types are deprecated from ES v6.0.0 onwards.
- Document: A Document is the lowest level of unit which represents data. Imagine it like a JSON Object which contains your data. It is possible to index as many documents inside an Index.
Types of search in Elasticsearch
Elasticsearch is known for its near real-time searching capabilities and the flexibilities it provides with the type of data being indexed and searched.
- Structured Search: This type of search is run on data which has a pre-defined format like Dates, times, and numbers. With pre-defined format comes the flexibility of running common operations like comparing values in a range of dates. Interestingly, textual data can be structured too. This can happen when a field has fixed number of values. For example, Name of Databases can be, MySQL, MongoDB, Elasticsearch, Neo4J With structured search, the answer to the queries we run is either a yes or no.
- Full-Text Search: This type of search is dependent on two important factors, Relevance and Analysis. With Relevance, we determine how well some data matches to the query by defining a score to the resultant documents. This score is provided by ES itself. Analysis refers to breaking the text into normalized tokens to create an inverted index.
- Multifield Search: With the number of analytic queries ever increasing on the stored data in ES, we do not usually just face simple match queries. Requirements have grown to run queries which span across multiple fields and have a scored sorted list of data returned to us by the database itself. This way, data can be present to the end user in a much more efficient way.
- Proximity Matching: Queries today is much more than just identifying if some textual data contains another string or not. It is about establishing the relationship between data so that it can be scored and matched to the context in which data is being matched. For example:
- Ball hit John
- John hit the Ball
- John bought a new Ball which was hit Jaen garden
A match query will find all three documents when searched for Ball hit. A proximity search can tell us how far these two words appear in the same line or paragraph due to which they matched.
- Partial Matching: It is often we need to run partial-matching queries. Partial Matching allows us to run queries which matches partially.
SQL Queries: Partial Matching
WHERE name LIKE “%john%”
AND name LIKE “%red%”
AND name LIKE “%garden%”
Integration with Kibana
When it comes to an analytics engine, we usually need to run analysis queries in a Business-Intelligence (BI) domain. When it comes to Business Analysts or Data Analysts, it wouldn’t be fair to assume that people know a programming language when they want to visualize data present in ES Cluster. This problem is solved by Kibana.
Kibana offers so many benefits to BI that people can visualize data with an excellent, customizable dashboard and see data interactively.
Interactive Charts
At the core of Kibana is Interactive Charts as shown below:

Kibana comes supported with various type of charts like pie charts, sunbursts, histograms and much more which uses the complete aggregation capabilities of ES.
Mapping Support
Kibana also supports complete Geo-Aggregation which allows us to geo-map our data.

Pre-built Aggregations and Filters
With Pre-built Aggregations and Filters, it is possible to literally frag, drop and run highly optimized queries within the Kibana Dashboard. With just a few clicks, it is possible to run aggregated queries and present results in the form of Interactive Charts.
Easy Distribution of Dashboards
With Kibana, it is also very easy to share dashboards to a much wider audience without doing any changes to the dashboard with the help of Dashboard Only mode. We can easily insert dashboards into our internal wiki or webpages.
Exploring Dev Tool
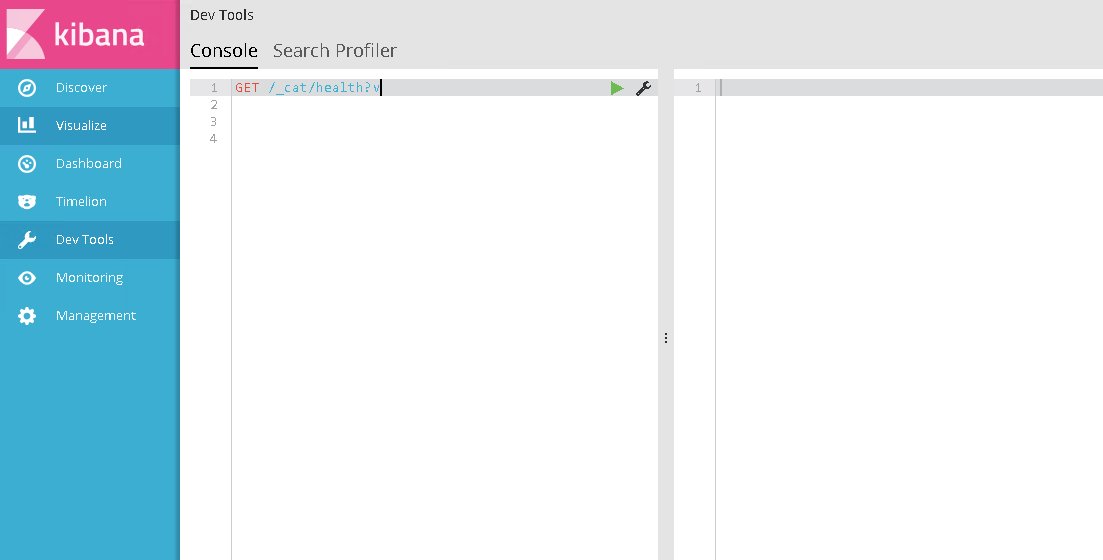
Dev Tools refers to the development tools that aid the developer. In Kibana, it is used for the Console UI, which provides a simple yet clean interface to access API queries using the REST API exposed by the Elasticsearch client. Console allows us to make any API call from a web browser. Its interface gives us a clean way to make a call and generates JSON in a pretty print format, which allows you to view results in a neat way. It works on top of an HTTP layer of an Elasticsearch cluster.
Upon clicking Dev Tools, you will be greeted with the Console UI, as shown in the following screenshot:
Elasticsearch with Xpack security
X-Pack is an Elastic Stack extension that bundles security, alerting, monitoring, reporting, and graph capabilities into one easy-to-install package. While the X-Pack components are designed to work together seamlessly, you can easily enable or disable the features you want to use.
Prior to Elasticsearch 5.0.0, you had to install separate Shield, Watcher, and Marvel plugins to get the features that are bundled together in X-Pack. With X-Pack, you no longer have to worry about whether or not you have the right version of each plugin, just install the X-Pack for the Elasticsearch version you’re running, and you’re good to go!
Monitoring Elasticsearch
X-Pack monitoring enables you to easily monitor the health of your Elasticsearch cluster. The monitoring metrics are collected from each node and stored in Elasticsearch indices.
You can view the monitoring data from Kibana where it’s easy to spot issues at a glance or delve into the system behavior over time to diagnose operational issues. In addition to the built-in status warnings, you can also set up custom alerts based on the data in the monitoring indices.

Author : Chanaka Liyanarachchi is a Senior DataOps Engineer at CMS. He works with technologies such as ElasticSearch, Cassandra, Aerospike, Kafka, SQL Server & various other AWS related data technologies.